Visual Complexity
Introduction and Chapter 1
Manuel Lima starts his book introduction describing how he started his research. During his MFA he became interested in visual representation of networks, taking the blogosphere as the “laboratory to track and analyze how trends, ideas, and information travel through different online social groups” (Lima, 15). As his research progressed, he realized that the “network” as a structure is present in most systems, from the brain to the website.
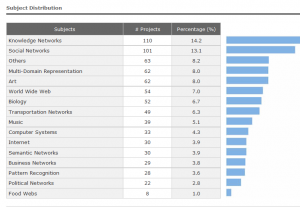
In 2005 he launched his online site call Visual Complexity, with the goal of “facilitate a critical understanding to different network- visualization methods across the widest spectrum of knowledge.” (Lima, 16) Please take a look of the site; it has thousands of different projects of network representations as well as blog posts and a statistics section that show percentages of the most popular subjects, most research keywords, etc. http://www.visualcomplexity.com
Also in the introduction the author mention the problem of the temporary lifespan of most online visualizations. There are several reasons for that: authors don’t update codes, differences in formats or the application programming interface (API), domains taken down from servers, etc. In his book, Lima also wants to preserve and be a source of information for next generations of material that may disappear from the web in the near future.
I think that this point is extremely important for the Digital Humanities, as we had talked in class of the different formats and coding changing trough time, here we have an example of the need of preservation. How the author does that? Taking the digital to paper.
The book combines 2 disciplines: network science and information visualization. Lima says that network science “examines the interconnection” of various systems and information visualization “visually translate” data. It’s extremely important to recognize the interaction of different disciplines in the creation of information visualization, and the use of visual tools to TRANSLATE… to create something new.
The first chapter of the book focuses on the history of trees as system of representation and organizers usually highlighting a hierarchical order. The author mentions the meaning of trees and the various representations trough history.
He starts with the Sacred Trees and the three of life. Those representations are present in most religions and cultures; from the Garden of Eden to the Sephirotic tree in the Jewish tradition of Kabbalah. He continues with the Trees of Knowledge, explaining that because of its metaphorical structure it has been use for thousands of years to explain, classify and organize. For its shape, it helps to illustrate relationships: multiplicity and unity. Threes become then a common know tool for two major domains: genealogy and classification.
If we focus on the images that the author present as examples of the evolution of the use of trees as representation and organization tools we can fall in two readings. We may tend to simplify its meaning from only looking at the beautiful images and reading the nice story. We can focus on the aesthetic aspect, and see that many of them were done on animal skins, using elaborated fonts and images with a lot of detail on the use of symbols and color. Also we can think on what information is display in there, what are the words, what are the connections. That could be a good start, but for me the most important thing is to see those representations in their context. I think that the author doesn’t make enough emphasis on why those trees are important thru history. The key is the level of abstraction that a person needs to have to be able to use a visual image that maybe nothing has to deal with what you are representing.
Lima mentions the evolution of classification, from Aristotle to the Tree of Porphry, the Book of figures and the Tree of Science in the medieval era. Later on the chapter under the title of The consolidation: Francis Bacon and Rene Descartes, he describes the collaboration of the philosophers and how they used the classification, categories and divisions to explain their thoughts. Both Bacon and Descartes used the image of trees as a metaphor for Philosophy. But neither of them developed an actual visual image of the tree of knowledge. In 1728 Ephraim Chambers published Cyclopaedia, one of the first encyclopedias in English. One of his biggest visual contribution was the introduction of a horizontal tree diagram witch in hierarchal order is read from left to right.
By the middle of the eighteen century, Denis Diderot and Jean le Rond d’ Alembert published the Encyclopedie inspired in Chambers work. Diderot explained, “Thanks to the encyclopedic ordering, the universality of knowledge, and the frequency of references … we perceive either continuity or the gaps in our system, its weak sides, its strong points, and at a glance on which objects it is important to work for one’s own glory, or for the greater utility to humankind…” (Lima, 39).
Lima ends his chapter mentioning that through time tree diagrams have transformed and have gain a “generic nonfigurative design” becoming practical tools but still using the labels of the past: root, branches and leaves.

I think it’s really interesting that in his effort to preserve what is online he puts it into print. What is that saying about how he feels about the sustainability of online work? Do we need to have things in print for them to last? Should DHer’s be concerned with the issue of preservation? We have online archives which in theory do a lot more than print archives in terms of the amount of data available and the accessibility to a wider audience. I also think it’s interesting that he offers to forms of his work, the print and then the website. He is almost creating a hybrid of information, he is creating two venues of access which opens up his work to both traditional readers and digital readers.